Twitter’s Anomaly Detection was originally built in R, and python packages that reproduce it tend to require dependencies on R as well.
Well, not this one! Check out https://github.com/wdm0006/pyculiarity
Amazing stuff.
I downloaded some ec2 cpu utilisation data with anomalies from the Numenta Anomaly Benchmark (NAB) https://www.kaggle.com/boltzmannbrain/nab/data, pip installed pyculiar and BOOM - with a few lines of code:
import pandas as pd
import numpy as np
from pyculiarity import detect_ts
import matplotlib.pyplot as plt
%matplotlib inline
# read in data
cpu_util = pd.read_csv('ec2_cpu_utilization_24ae8d.csv')
# convert timestamp string to datetime, then to unix timestamp integer
cpu_util['timestamp'] = pd.to_datetime(cpu_util['timestamp'])
cpu_util['timestamp'] = cpu_util['timestamp'].astype(np.int64) // 10**9
# run the model
results = detect_ts(cpu_util, max_anoms=0.005, alpha=0.001, direction='both')
# format the unix timestamp integer back to datetime
cpu_util['timestamp'] = pd.to_datetime(cpu_util['timestamp'])
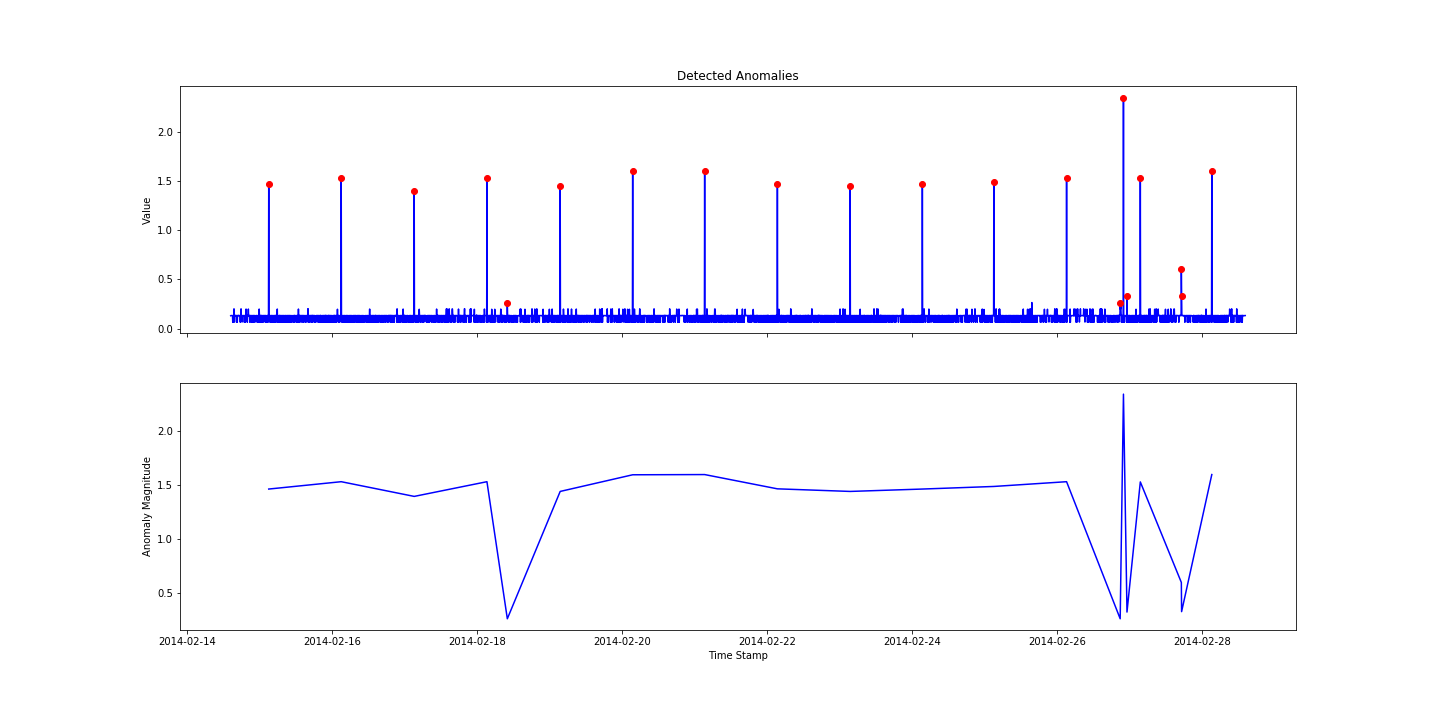
# plot the graphs
f, ax = plt.subplots(2, 1, sharex=True, figsize=(20, 10))
ax[0].plot(cpu_util['timestamp'], cpu_util['value'], 'b')
ax[0].plot(results['anoms'].index, results['anoms']['anoms'], 'ro')
ax[0].set_title('Detected Anomalies')
ax[0].set_ylabel('Value')
ax[1].plot(results['anoms'].index, results['anoms']['anoms'], 'b')
ax[1].set_xlabel('Time Stamp')
ax[1].set_ylabel('Anomaly Magnitude')
# save the plot
plt.savefig('aws.png')