A million years since i’ve been here!!
Today’s interesting topic of the day - GPS plots!
Plotly and folium have made things so much easier these days - no tokens whatsoever required please
below are mostly from the documentation pages - just extracting the critical bits so its easier for everyone!
1) Doing a scatterplot of points on a map
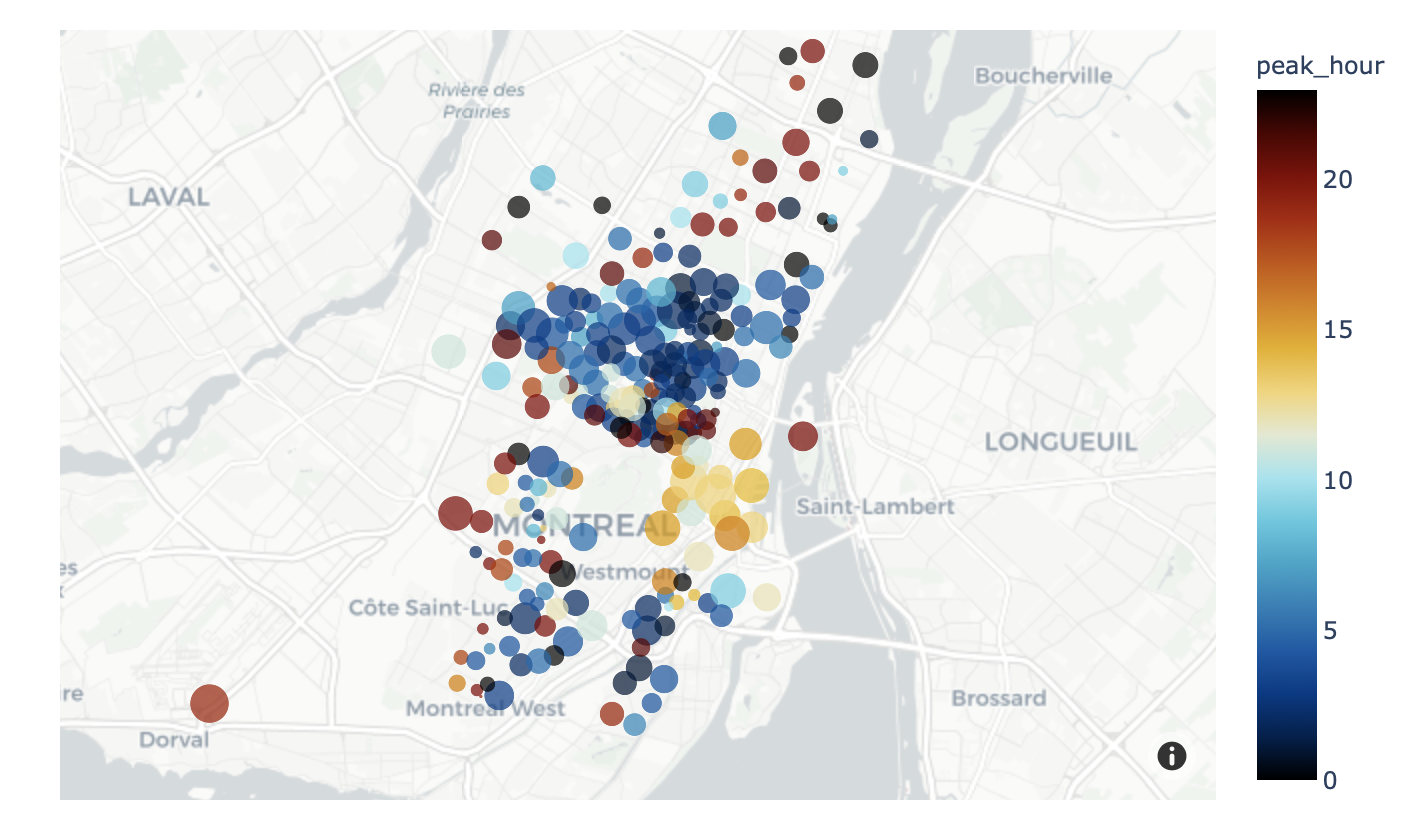
import plotly.express as px
df = px.data.carshare()
fig = px.scatter_mapbox(df,
                        lat="centroid_lat",
                        lon="centroid_lon",
                        color="peak_hour",
                        size="car_hours",
                        color_continuous_scale=px.colors.cyclical.IceFire,
                        mapbox_style="carto-positron",
                        size_max=15,
                        zoom=10)
fig.show()
You can also use fig.write_html("file.html") instead of show to write to an interactive html file!
Change “carto-positron” to “open-street-map” to use maps from OSM! Full list of free raster tiles here: https://plotly.com/python/mapbox-layers/
2) Drawing polygons on a map
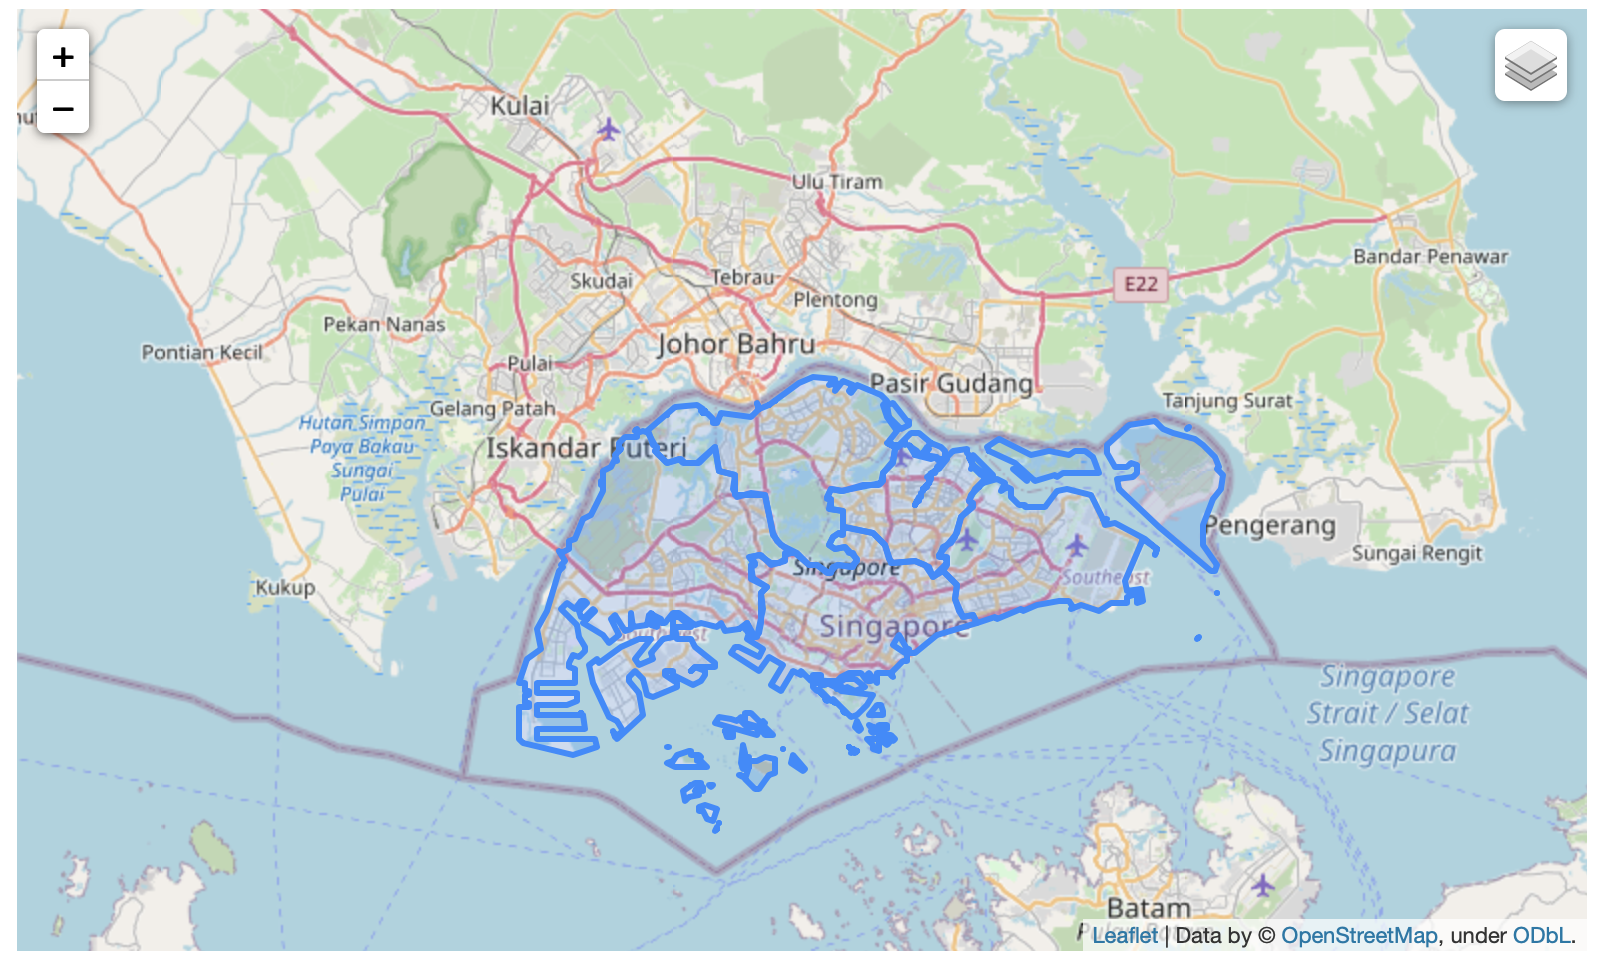
You can download a geojson from here (full credits to the owner!): https://raw.githubusercontent.com/yinshanyang/singapore/master/maps/1-region.geojson
import geopandas as gpd
import folium

# load data
gdf = gpd.read_file('1-region.geojson')

# plot
m = folium.Map(location=[1.4, 103.8], zoom_start=10)

folium.GeoJson(gdf
).add_to(m)

folium.LayerControl().add_to(m)

m
3) Drawing polygons on a map with additional information as colour
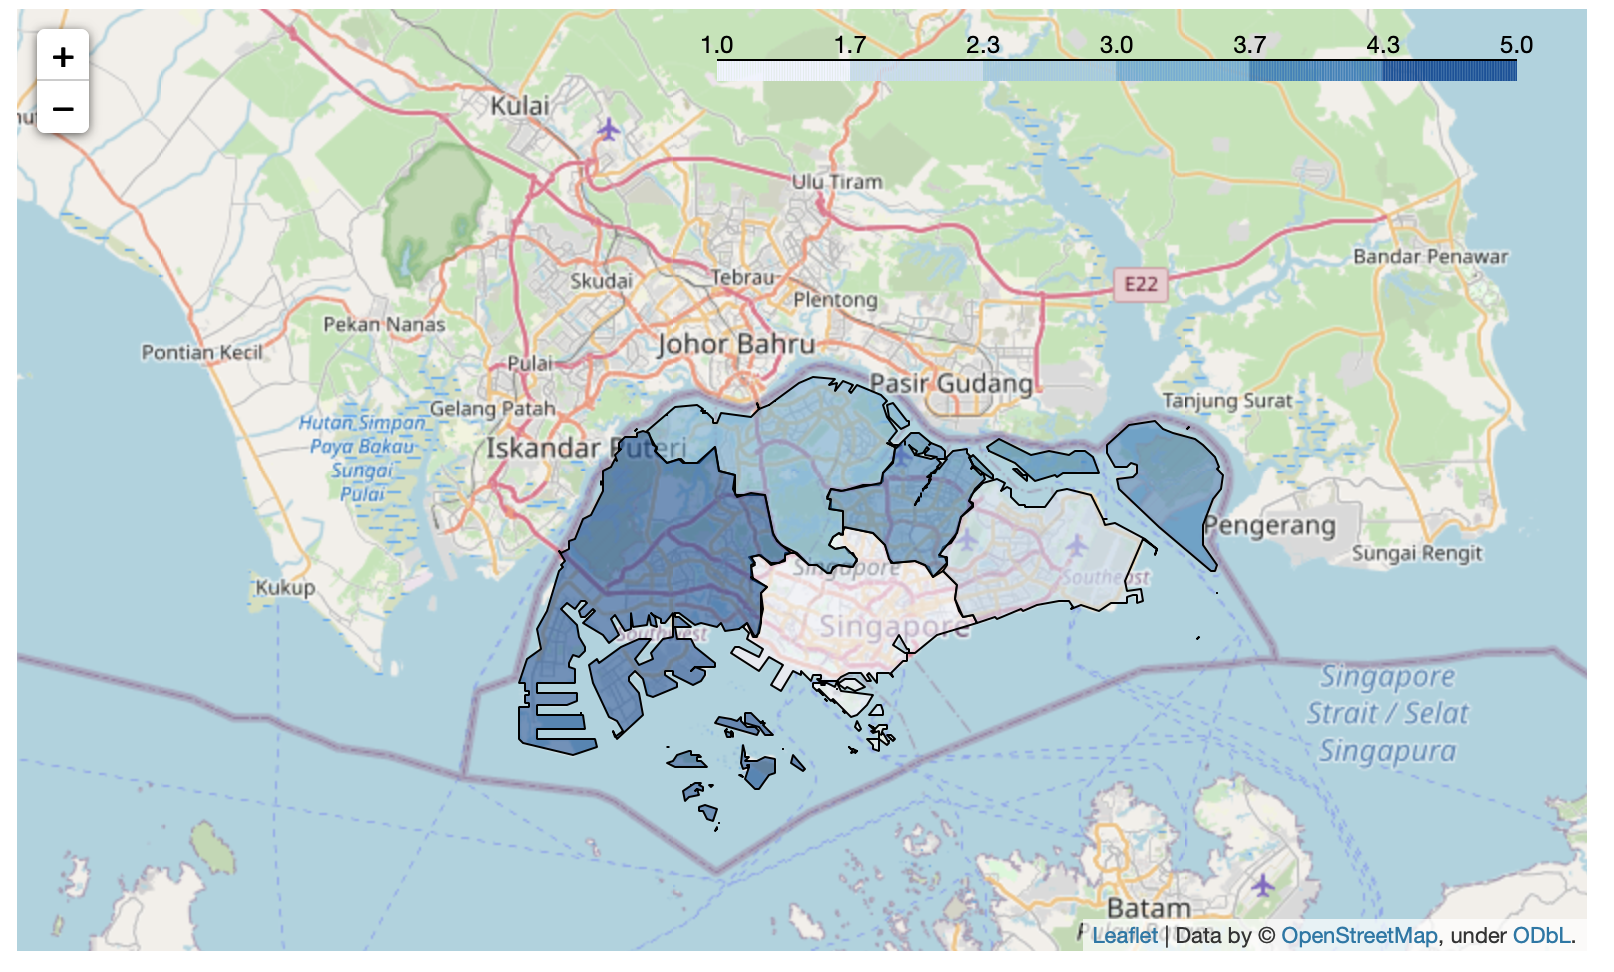
import pandas as pd
import geopandas as gpd
import folium

# load data
gdf = gpd.read_file('1-region.geojson')

df = pd.DataFrame([
    ['CENTRAL REGION', 1],
    ['EAST REGION', 2],
    ['NORTH REGION', 3],
    ['NORTH-EAST REGION', 4],
    ['WEST REGION', 5],
                  ], columns=['name', 'display_color'])

m = folium.Map(location=[1.4, 103.8], zoom_start=10)

folium.Choropleth(geo_data='1-region.geojson', data=df,
             columns=['name', 'display_name'],
             key_on='feature.properties.name',
             color='display_color').add_to(m)
m